Examples
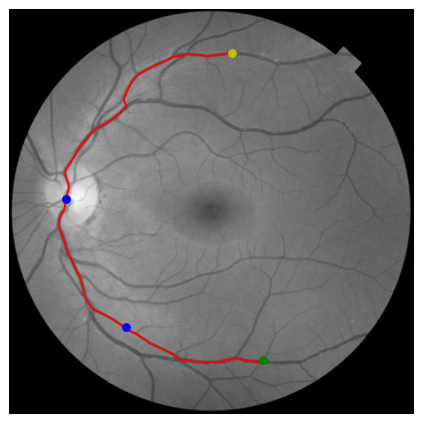
Retina Vessels
Extracting the minimal path through the retina vessels with additional way points.
from skimage.data import retina
from skimage.color import rgb2gray
from skimage.transform import rescale
from skimage.filters import sato

from skmpe import mpe

image = rescale(rgb2gray(retina()), 0.5)
speed_image = sato(image)

start_point = (76, 388)
end_point = (611, 442)
way_points = [(330, 98), (554, 203)]

path_info = mpe(speed_image, start_point, end_point, way_points)

px, py = path_info.path[:, 1], path_info.path[:, 0]

plt.imshow(image, cmap='gray')
plt.plot(px, py, '-r')
plt.plot(*start_point[::-1], 'oy')
plt.plot(*end_point[::-1], 'og')
for p in way_points:
    plt.plot(*p[::-1], 'ob')
plt.axis('off')
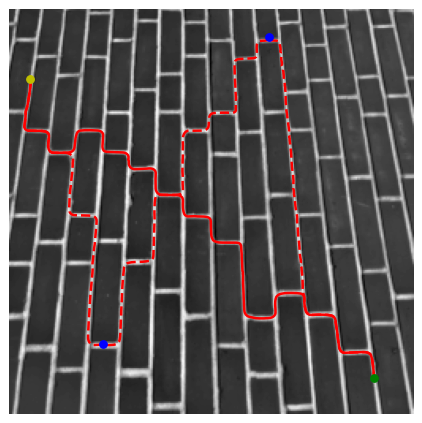
Bricks
Extracting the shortest paths through “bricks” image.
from skimage.data import brick
from skimage.transform import rescale
from skimage.exposure import rescale_intensity, adjust_sigmoid

from skmpe import parameters, mpe

image = rescale(brick(), 0.5)
speed_image = rescale_intensity(
    adjust_sigmoid(image, cutoff=0.5, gain=10).astype(np.float_), out_range=(0., 1.))

start_point = (44, 13)
end_point = (233, 230)
way_points = [(211, 59), (17, 164)]

with parameters(integrate_max_step=1.0):
    path_info1 = mpe(speed_image, start_point, end_point)
    path_info2 = mpe(speed_image, start_point, end_point, way_points)

px1, py1 = path_info1.path[:, 1], path_info1.path[:, 0]
px2, py2 = path_info2.path[:, 1], path_info2.path[:, 0]

plt.imshow(image, cmap='gray')
plt.plot(px1, py1, '-r', linewidth=2)
plt.plot(px2, py2, '--r', linewidth=2)

plt.plot(*start_point[::-1], 'oy')
plt.plot(*end_point[::-1], 'og')
for p in way_points:
    plt.plot(*p[::-1], 'ob')
plt.axis('off')
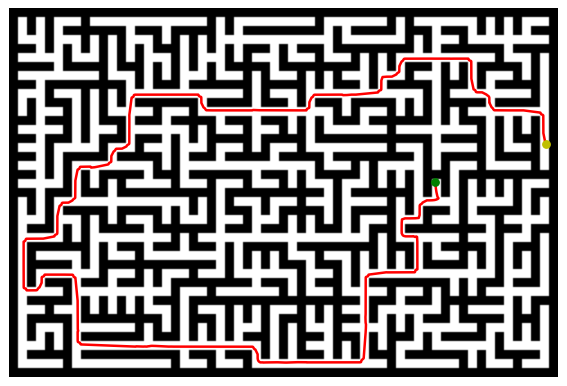
Maze
Finding the path in the maze.
from skimage.io import imread
from skimage.exposure import rescale_intensity

from skmpe import parameters, mpe, OdeSolverMethod

image = imread('_static/maze.png', as_gray=True).astype(np.float_)
speed_image = rescale_intensity(image, out_range=(0.005, 1.0))

start_point = (60, 238)
end_point = (77, 189)

with parameters(ode_solver_method=OdeSolverMethod.LSODA, integrate_max_step=1.0):
    path_info = mpe(speed_image, start_point, end_point)

path = path_info.path

plt.imshow(image, cmap='gray')
plt.plot(path[:, 1], path[:, 0], '-r', linewidth=2)

plt.plot(*start_point[::-1], 'oy')
plt.plot(*end_point[::-1], 'og')

plt.axis('off')